Description
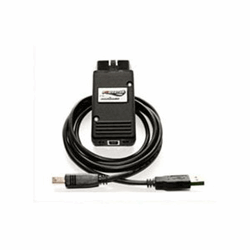
What' included: Powertap interface Maestro software suite consisting of: Eurodyne Flash Maestro logging software Maestro Editor Powertap® Interface The Powertap® interface is an intelligent high speed interface device that contains a 16bit micro controller with dedicated hardware for both CAN bus and K-line protocols. The Powertap interface supports high speed communication not available when using generic interface cables and allows communications with your engine controller giving you access to the many features and capabilities in included in the Maestro Tuning Suite. Eurodyne Flash Eurodyne Flash software package once loaded onto your computer provides the interface that allows the user to: flash and reflash the ECU using a file selected from our library retrieve and clear fault codes view measuring blocks start logging function initiates Powertap Firmware updates launch quick tune (some applications) activate 2 step (some applications) turn emission diagnostics on and off (to be used for off road applications) read ECU identification information free firmware upgrades as features are added Eurodyne Maestro Editor Eurodyne Editor is a a complete high speed data logging package that provides graphing and map tracing features and the Maestro map editor. This powerful software package allows access to all relevant maps, scalars and switches inside the ECU binary. Editing wizards are included to speed the implementation of map adjustments. Once edititing is complete file can be saved under a new name the uploaded to your engine controller. import data logs and view correction values modify values in multiple cells using the stored correction values injector wizard capable of modifying appropriate maps when injectors are resized view histograms to pinpoint cells used during a specific engine sequence Eurodyne Log Viewer A graphic interface that interprets and plays back .csv logs recorded using Eurodyne Flash. Log viewer provides three visual display modes and user selectable graph variables. Up to 20 values can be viewed in one of three different modes: text view gauge view graph view
